groovyConsole - the Groovy Swing console
1. Groovy : Groovy Console
The Groovy Swing Console allows a user to enter and run Groovy scripts. This page documents the features of this user interface.
2. Basics
-
Groovy Console is launched via
groovyConsoleorgroovyConsole.bat, both located in$GROOVY_HOME/bin -
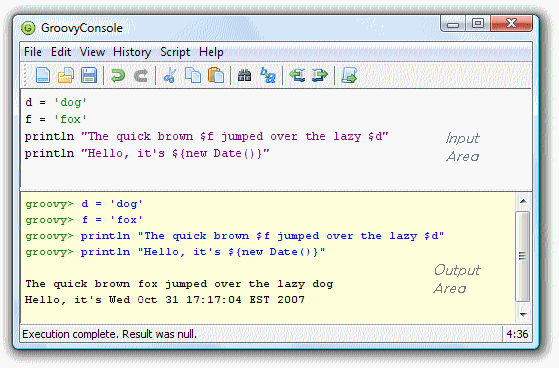
The Console has an input area and an output area.
-
You type a Groovy script in the input area.
-
When you select
Runfrom theActionsmenu, the console compiles the script and runs it. -
Anything that would normally be printed on
System.outis printed in the output area. -
If the script returns a non-null result, that result is printed.
3. Features
3.1. Command-line Options and Arguments
The Groovy Console supports several options to control classpath and other features.
./bin/groovyConsole --help
Usage: groovyConsole [options] [filename]
The Groovy Swing Console allows a user to enter and run Groovy scripts.
      --configscript=PARAM   A script for tweaking the compiler configuration options
      -cp, -classpath, --classpath
                             Specify where to find the class files - must be first
                               argument
  -D, --define=<name=value>  Define a system property
  -h, --help                 Display this help message
  -pa, --parameters          Generate metadata for reflection on method parameter
                               names (jdk8+ only)
  -pr, --enable-preview      Enable preview Java features (jdk12+ only)
  -V, --version              Display the version
3.2. Running Scripts
There are several shortcuts that you can use to run scripts or code snippets:
-
Ctrl+EnterandCtrl+Rare both shortcut keys forRun Script. -
If you highlight just part of the text in the input area, then Groovy runs just that text.
-
The result of a script is the value of the last expression executed.
-
You can turn the System.out capture on and off by selecting
Capture
System.out
from theActionsmenu
3.3. Editing Files
You can open any text file, edit it, run it (as a Groovy Script) and then save it again when you are finished.
-
Select
File > Open(shortcut keyctrl+O) to open a file -
Select
File > Save(shortcut keyctrl+S) to save a file -
Select
File > New File(shortcut keyctrl+Q) to start again with a blank input area
3.4. History and results
-
You can pop up a gui inspector on the last (non-null) result by selecting
Inspect Lastfrom theActionsmenu. The inspector is a convenient way to view lists and maps. -
The console remembers the last ten script runs. You can scroll back and forth through the history by selecting
NextandPreviousfrom theEditmenu.Ctrl-Nandctrl-Pare convenient shortcut keys. -
The last (non-null) result is bound to a variable named
_(an underscore). -
The last result (null and non-null) for every run in the history is bound into a list variable named
(two underscores). The result of the last run is[-1], the result of the second to last run is__[-2]and so forth.
3.5. Interrupting a script
The Groovy console is a very handy tool to develop scripts. Often, you will
find yourself running a script multiple times until it works the way you want
it to. However, what if your code takes too long to finish or worse, creates
an infinite loop? Interrupting script execution can be achieved by clicking
the interrupt button on the small dialog box that pops up when a script
is executing or through the interrupt icon in the toolbar.

However, this may not be sufficient to interrupt a script: clicking the button
will interrupt the execution thread, but if your code doesn’t handle the interrupt
flag, the script is likely to keep running without you being able to effectively
stop it. To avoid that, you have to make sure that the Script > Allow interruption
menu item is flagged. This will automatically apply an AST transformation to your
script which will take care of checking the interrupt flag (@ThreadInterrupt).
This way, you guarantee that the script can be interrupted even if you don’t explicitly
handle interruption, at the cost of extra execution time.
3.6. And more
-
You can change the font size by selecting
Smaller FontorLarger Fontfrom theActions menu -
The console can be run as an Applet thanks to
groovy.ui.ConsoleApplet -
Code is auto indented when you hit return
-
You can drag’n’drop a Groovy script over the text area to open a file
-
You can modify the classpath with which the script in the console is being run by adding a new JAR or a directory to the classpath from the
Scriptmenu -
Error hyperlinking from the output area when a compilation error is expected or when an exception is thrown
4. Embedding the Console
To embed a Swing console in your application, simply create the Console object, load some variables, and then launch it. The console can be embedded in either Java or Groovy code. The Java code for this is:
import groovy.ui.Console;

    ...
    Console console = new Console();
    console.setVariable("var1", getValueOfVar1());
    console.setVariable("var2", getValueOfVar2());
    console.run();
    ...
Once the console is launched, you can use the variable values in Groovy code.
5. Visualizing script output results
You can customize the way script output results are visualized. Let’s see how we can customize this. For example, viewing a map result would show something like this:
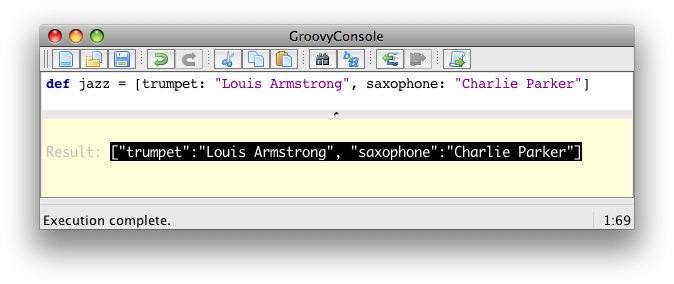
What you see here is the usual textual representation of a Map. But,
what if we enabled custom visualization of certain results? The Swing
console allows you to do just that. First of all, you have to ensure
that the visualization option is ticked: View → Visualize Script
Results — for the record, all settings of the Groovy Console are stored
and remembered thanks to the Preference API. There are a few result
visualizations built-in: if the script returns a java.awt.Image, a
javax.swing.Icon, or a java.awt.Component with no parent, the object is
displayed instead of its toString() representation. Otherwise,
everything else is still just represented as text. Now, create the
following Groovy script in ~/.groovy/OutputTransforms.groovy:
import javax.swing.*
transforms << { result ->
if (result instanceof Map) {
def table = new JTable(
result.collect{ k, v ->
[k, v?.inspect()] as Object[]
} as Object[][],
['Key', 'Value'] as Object[])
table.preferredViewportSize = table.preferredSize
return new JScrollPane(table)
}
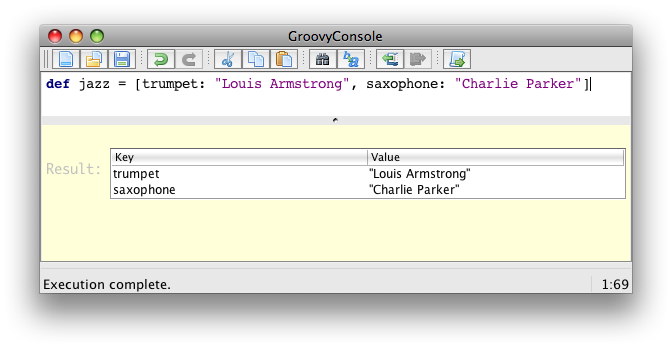
}The Groovy Swing console will execute that script on startup, injecting a transforms list in the binding of the script, so that you can add your own script results representations. In our case, we transform the Map into a nice-looking Swing JTable. We’re now able to visualize maps in a friendly and attractive fashion, as the screenshot below shows:
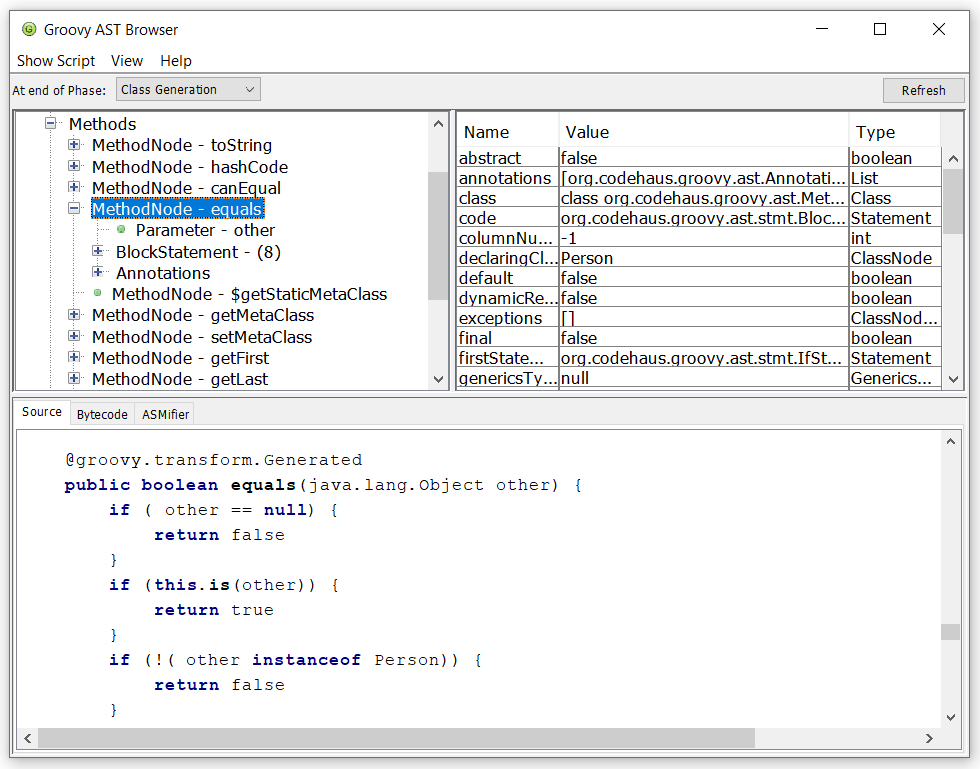
6. Advanced debugging: AST browser
Groovy Console can visualize the AST (Abstract Syntax Tree) representing
the currently edited script, as shown by the screenshot below. This is
useful when you want to understand how an AST transformation
is working and particularly handy if you are developing your own AST transform.
In the example below, we have annotated our class with the @Immutable annotation
and the Groovy compiler has generated a lot of boilerplate code for us.
We can see the code for the generated equals method in the Source tab.
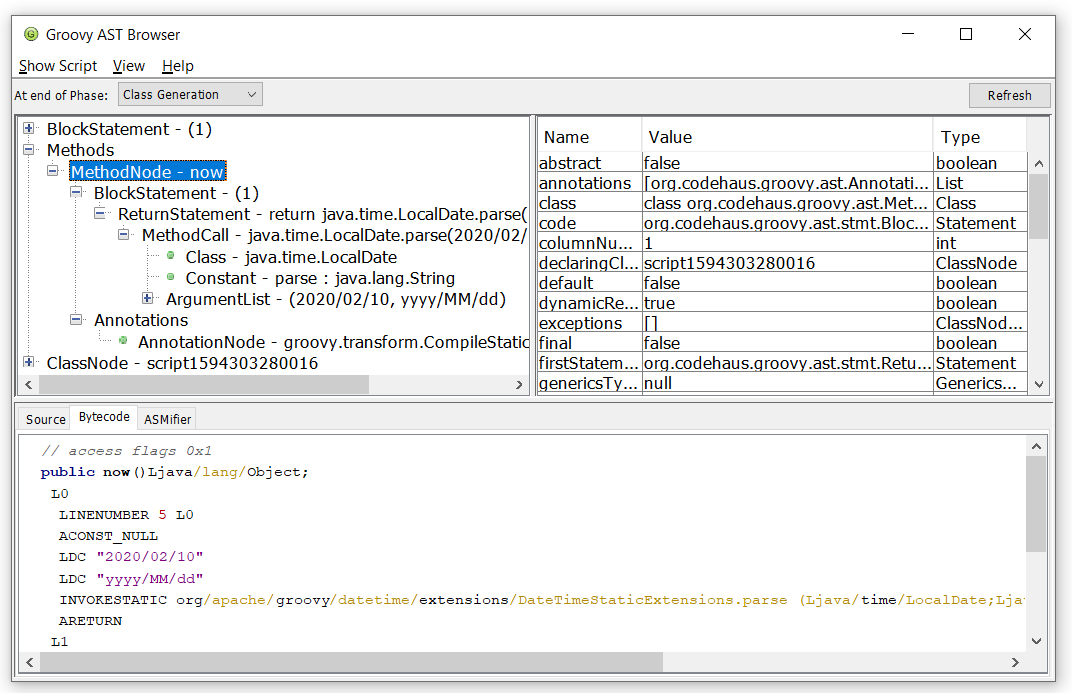
We can even examine the JVM bytecode generated by the compiler.
In the image below we are looking at the bytecode for the Groovy
expression LocalDate.parse('2020/02/10', 'yyyy/MM/dd').
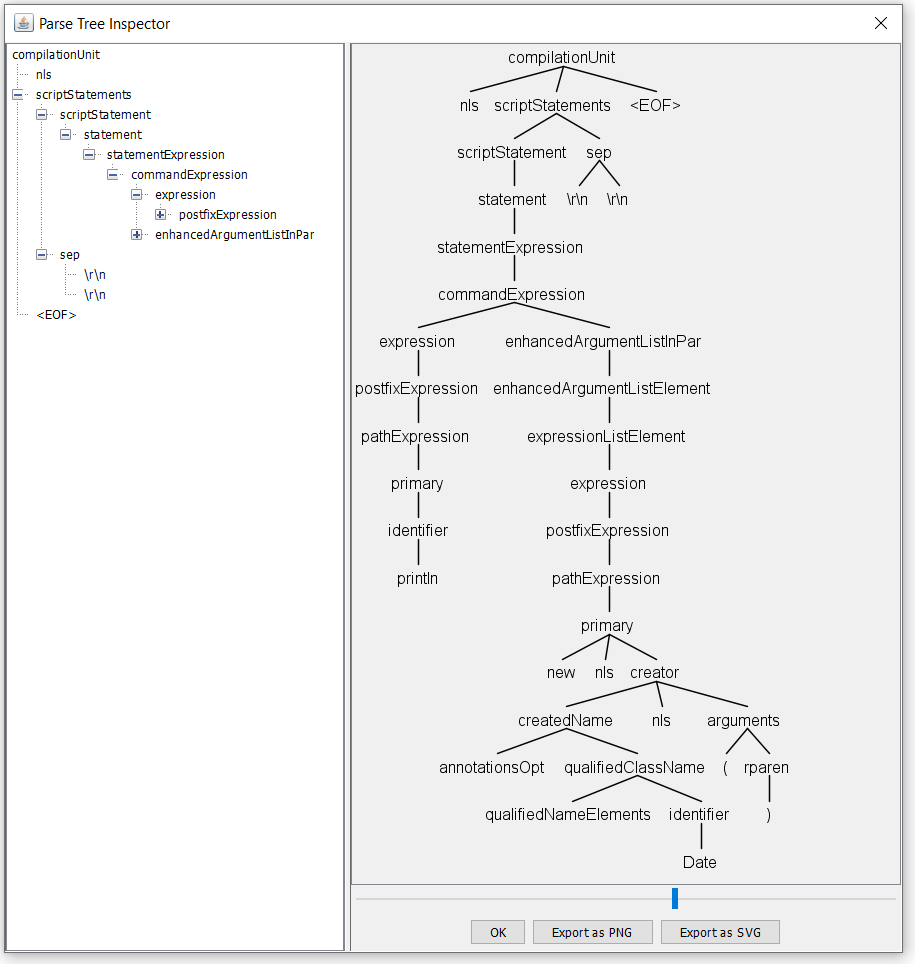
7. Advanced debugging: CST browser
Groovy Console can visualize the CST (Concrete Syntax Tree) representing the initial parsing of the script. This is mainly useful for parsing gurus.